Efe Oroh

Data Analytics | BI Dashboards | Automation | Applied Economics
Contact: EfeogheneOroh@gmail.com
Data Analytics Specialist
Technical Skills: Power BI, SQL, R, Python, SAS, MATLAB
Data Analyst specializing in Data Visualization, Report Automation, and scalable data analysis workflows using Power BI, R, Python, and SQL.
University of Alberta — Edmonton Alberta
Bachelor of Arts, Economics
- Relevant Coursework: Data Analysis with SAS, Python and R, Economic Forecasting, Applied Statistics, A/B Testing, Calculus II
- First Class Academic Standing (GPA > 3.5)
- Built and deployed an enterprise-scale Labour Market Insights dashboard in Power BI modeling a 45M-row dataset.
- Led advanced R & SQL analysis on migration impacts on Alberta’s labour market and automated the monthly reporting pipeline.
- Built a Power BI dashboard with real-time web-scraped emissions mapping.
- Spearheaded one of seven analytical segments in a Prairie economy report prepared for the Prime Minister's CIIT binder.
- Performed customer churn analysis for a $12.41B telecommunications company.
- Developed a machine learning churn prediction model exceeding identification targets by 10%.
Energy
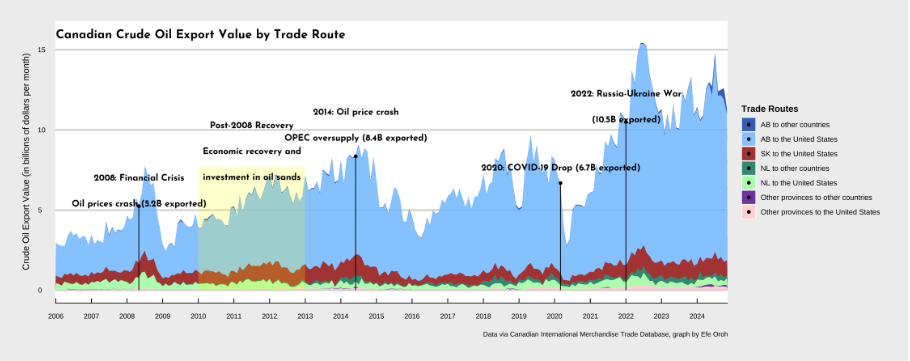
Analysis of Canada’s crude oil trade vulnerability examining tariffs, market access constraints, and reliance on U.S. imports.
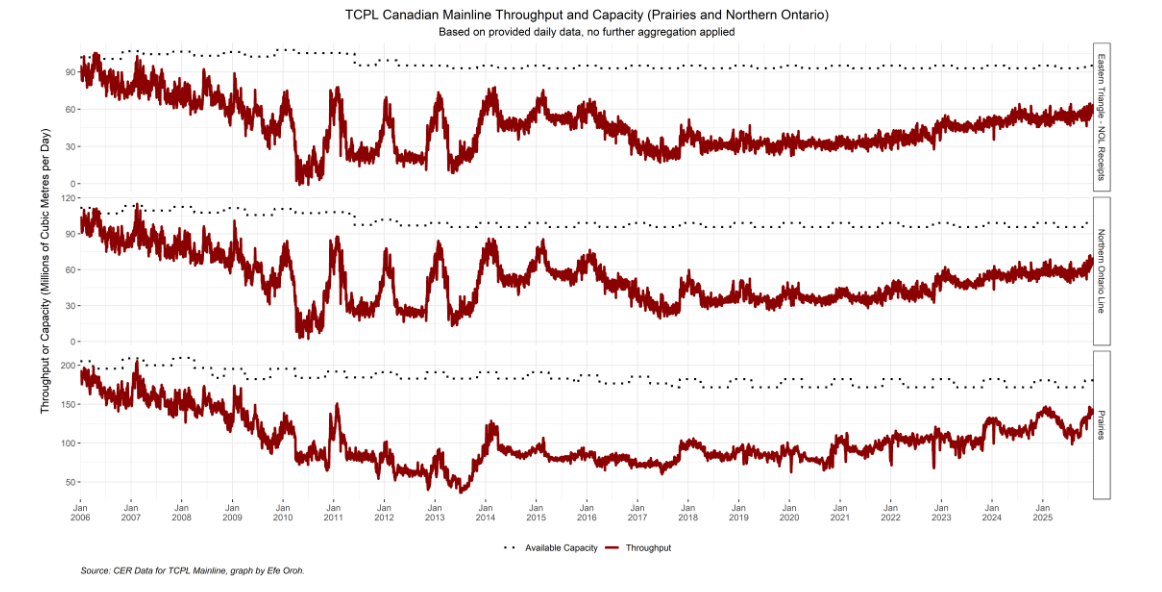
Analysis of Canada’s oil transportation infrastructure examining pipeline capacity, export routes, and production flows influencing Alberta royalty revenues.
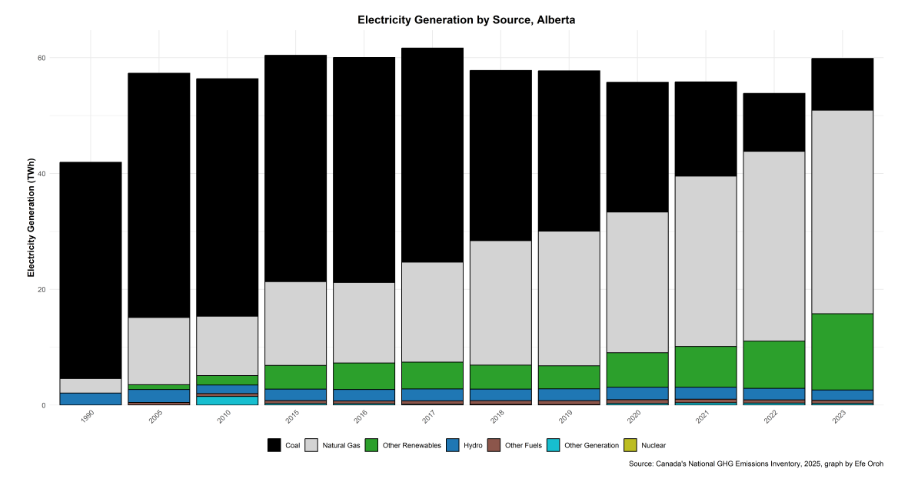
Analysis of Canada’s electricity generation mix and emissions trends across provinces.
Real Estate Analytics
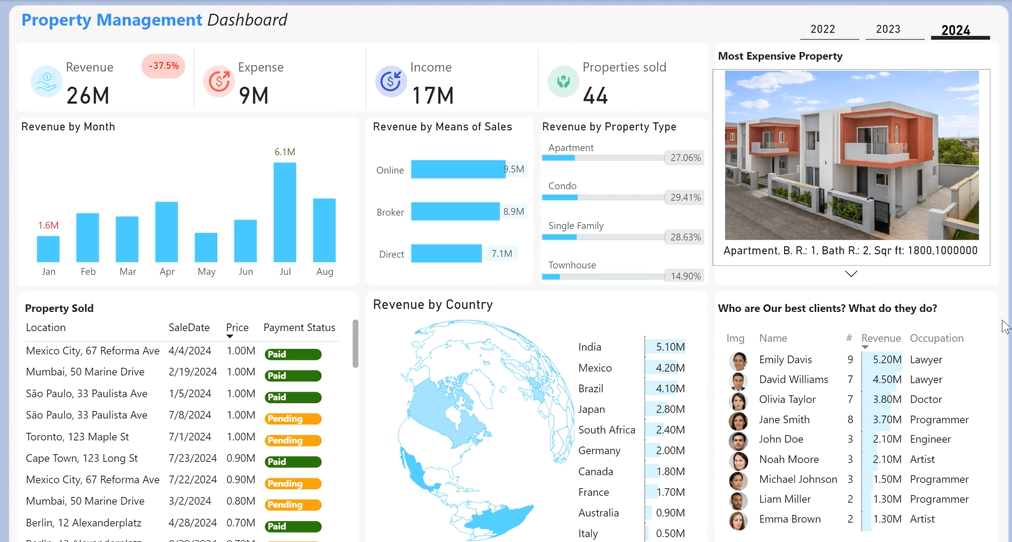
Interactive dashboard analyzing property performance, tenant trends, and operational metrics for real estate management decision-making.
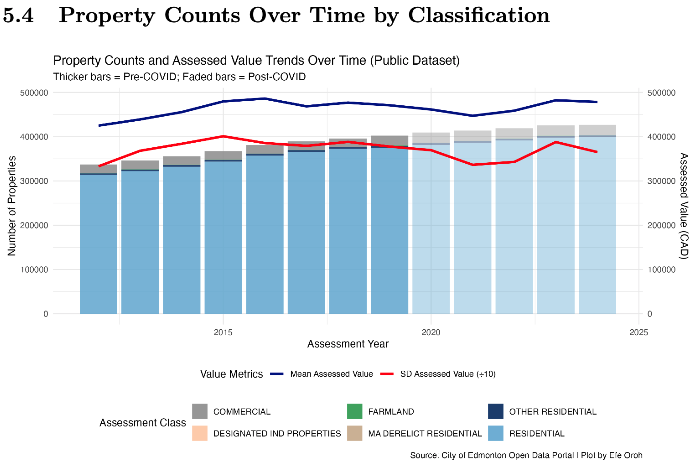
1st Place Winner and Cash Prize. Competition involving Masters+ and some Bachelors students tasked with analyzing City of Edmonton datasets to examine the impact of Covid-19 on Edmonton’s housing market. I led Section 5 — the core descriptive analysis, conducting large-scale exploratory analysis that identified the key structural changes in housing demand and price dynamics, which subsequently informed the predictive models built by the team.

Interactive Tableau story analyzing global Airbnb market trends, pricing dynamics, geographic distribution, and listing behavior to uncover actionable insights for hosts and investors.
Music Analytics
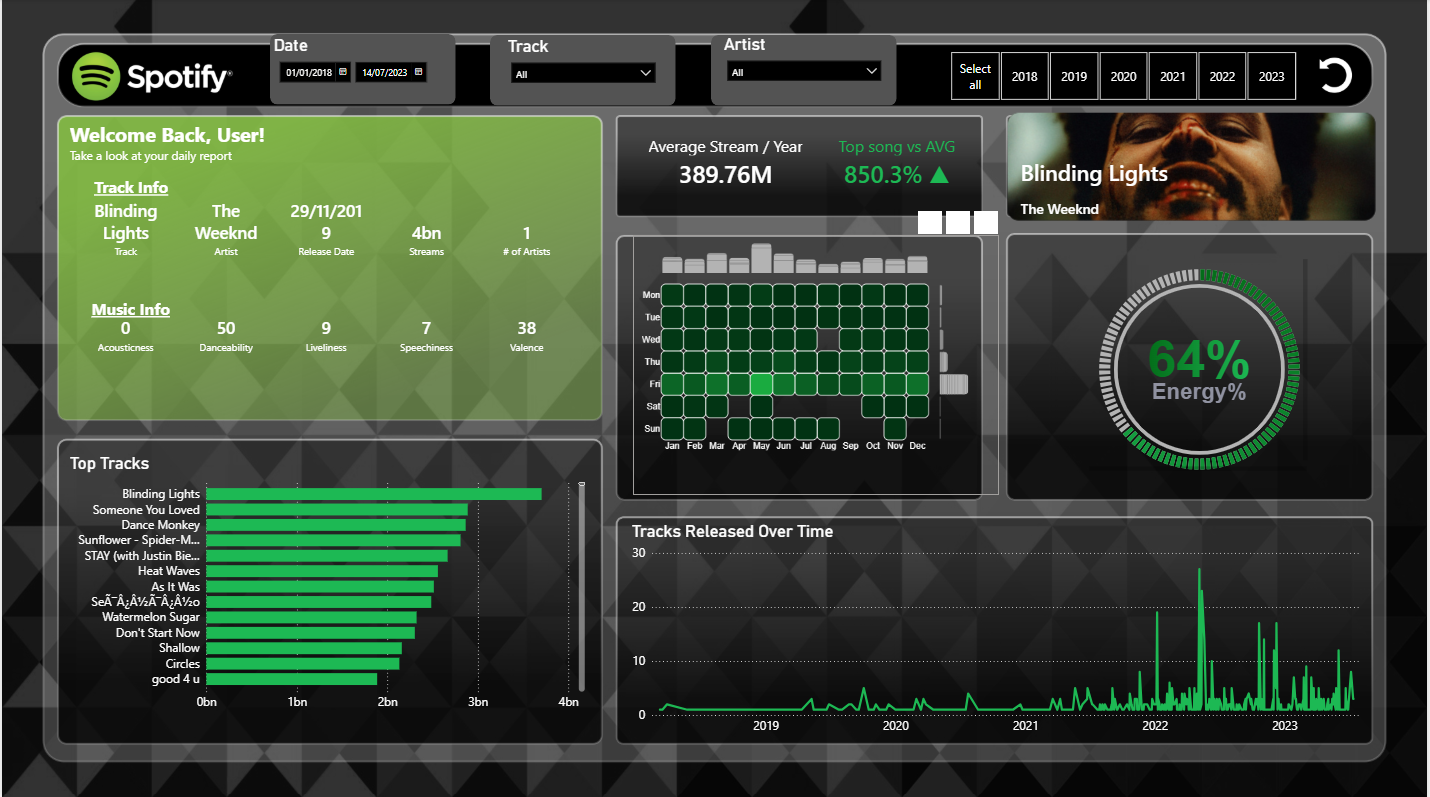
Interactive Power BI dashboard analyzing Spotify streaming performance and listening trends.
Automation

Automated report generation for 18 industries processing 2M+ rows of data and generating multiple industry reports simultaneously.
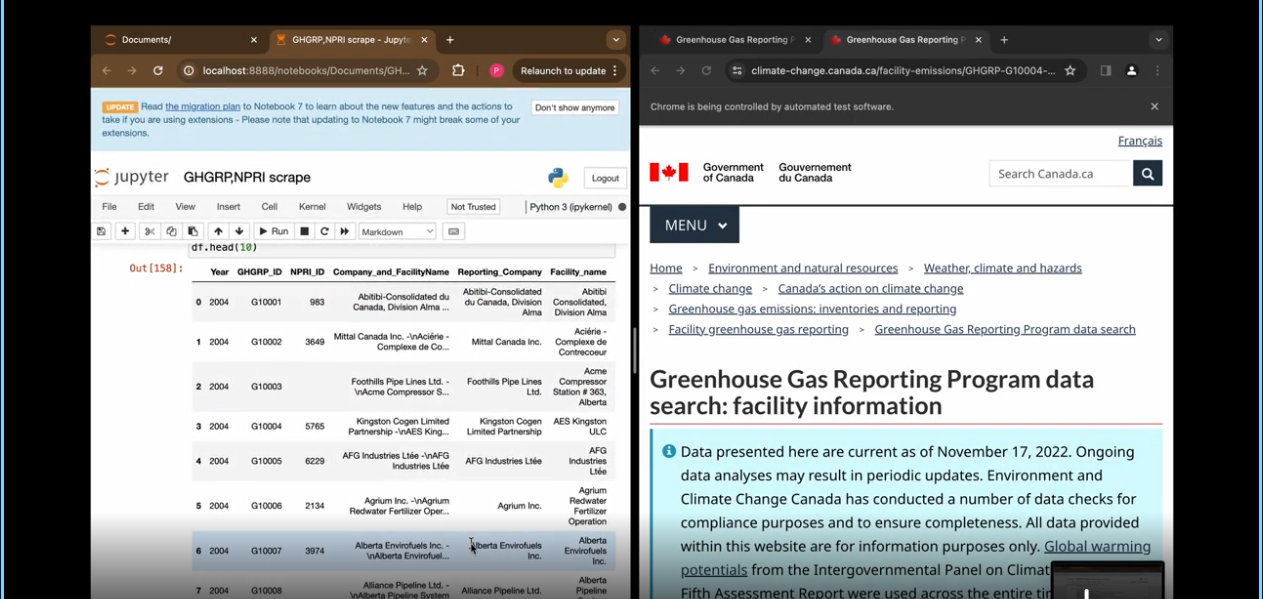
Automated the extraction and cleaning of 1M+ rows of greenhouse gas emissions data used in a GHG analytics dashboard. The workflow fully automated the data refresh pipeline for a dashboard requiring annual updates, eliminating manual data collection and ensuring reproducible updates each reporting cycle.
Automated the extraction and processing of 5M+ rows of Indigenous statistical data used in multiple recurring analytical reports.
Software Tools: Python, R, SQL, SAS, Tableau, Power BI, DAX, Statistics, Excel, Time Series, Databricks, Predictive Analytics, Prescriptive Analytics, A/B Testing, Data Analytics, Prompt Engineering, Jupyter Notebook